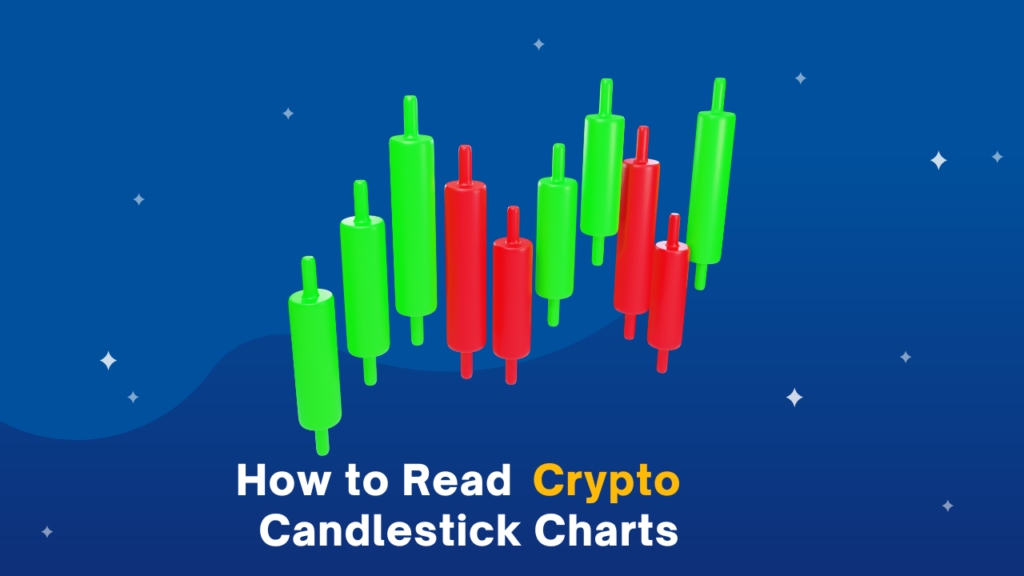
Crypto candlestick charts might look intimidating at first, with their flickering red and green shapes. But once you understand the basics, they become powerful tools to analyze market trends and make smart trading decisions.
What Is a Candlestick Chart?
A candlestick chart shows price movements of a cryptocurrency (like Bitcoin or Ethereum) over a specific period of time.
Each “candlestick” tells a story of what the price did during that period—whether that’s 1 minute, 1 hour, 1 day, etc.
Imagine a candlestick as a mini battle between buyers and sellers during that time frame.
Anatomy of a Candlestick
Each candlestick has four key data points:
- Open: The price at the beginning of the time frame.
- Close: The price at the end of the time frame.
- High: The highest price reached.
- Low: The lowest price reached.
Green (or White) Candlestick:
- Close is higher than open → Price went up.
- Buyers were stronger.
Red (or Black) Candlestick:
- Close is lower than open → Price went down.
- Sellers had more control.
The Candlestick’s Parts:
- Body: The thick part—shows open and close prices.
- Wicks (or shadows): The thin lines—show the highest and lowest prices.
- The upper wick = price reached a high but didn’t stay there.
- The lower wick = price dropped but bounced back.
Time Frames Matter
Each candlestick represents a period you choose:
- 1-minute chart = each candle shows 1 min of activity
- 1-day chart = each candle shows a whole day’s activity
Pro tip: Use short timeframes (1m, 5m, 15m) for day trading, and longer timeframes (1D, 1W) for investment analysis.
Basic Candlestick Patterns (Made Simple)
These patterns can give you clues about what might happen next.
Bullish Patterns (Price might go UP)
1. Hammer
- Small body, long lower wick
- Shows sellers tried to push price down, but buyers won
- Found at the bottom of a downtrend
2. Bullish Engulfing
- A small red candle followed by a big green one
- The green candle “engulfs” the red one
- Suggests strong buyer momentum
Bearish Patterns (Price might go DOWN)
1. Shooting Star
- Small body, long upper wick
- Price shot up but dropped back quickly
- Found at the top of an uptrend
2. Bearish Engulfing
- A small green candle followed by a large red one
- Shows sellers have taken control
Trend Indicators: Watch the Flow
Candlestick charts are even more powerful when you look at multiple candles together. Here are three common trends:
- Uptrend = Series of higher highs and higher lows
- Downtrend = Series of lower highs and lower lows
- Sideways/Range = Price bounces between support and resistance
Real-Life Example: BTC/USD Daily Chart
Imagine this scenario:
You’re looking at Bitcoin’s daily chart. You see a hammer candle at the end of a long downward trend. The next day, there’s a big green candle.
That combo suggests a potential reversal — time to consider a buy (if other indicators confirm it).
Expert Tips for Reading Candlestick Charts
- Don’t rely on one candle alone. Patterns work better in context.
- Volume matters. Look for candles with high volume for stronger signals.
- Combine with indicators. RSI, moving averages, and MACD add confirmation.
- Practice spotting patterns on demo charts before trading real money.
FAQs: Crypto Candlestick Charts
What’s the difference between a candlestick chart and a line chart?
A line chart shows only the closing prices. A candlestick chart gives you a fuller story — open, high, low, close. It’s way more informative.
Can beginners trade using candlestick charts?
Absolutely! Once you know the basics, candlestick patterns are easy to recognize. But always combine them with other analysis tools and manage your risk.
Which time frame is best for candlestick analysis?
Depends on your style:
- Scalping/Day trading: 1m to 15m
- Swing trading: 1h to 4h
- Investing: 1D to 1W
Are candlestick patterns always accurate?
No pattern is 100% accurate. They suggest possibilities, not guarantees. Use them as part of a bigger strategy.
Where can I practice reading candlestick charts?
Try free platforms like:
- TradingView
- Binance (Charting tools)
- CoinMarketCap (basic view)
Final Thoughts
Reading crypto candlestick charts is like learning a new language. Once you understand what the candles are “saying,” you gain a huge edge in your crypto journey.
Start simple. Look for trends. Learn a few key patterns. And remember, candlesticks don’t predict the future — they just help you read the present more clearly.


